Cron Monitoring
Ever setup a cron job that worked so well that you set it up and forgot about it only to find out it stopped working after awhile and you had no idea?
Central Logging can alert you when your cron or background jobs fail or stop reporting in, so there are no more silent failures.
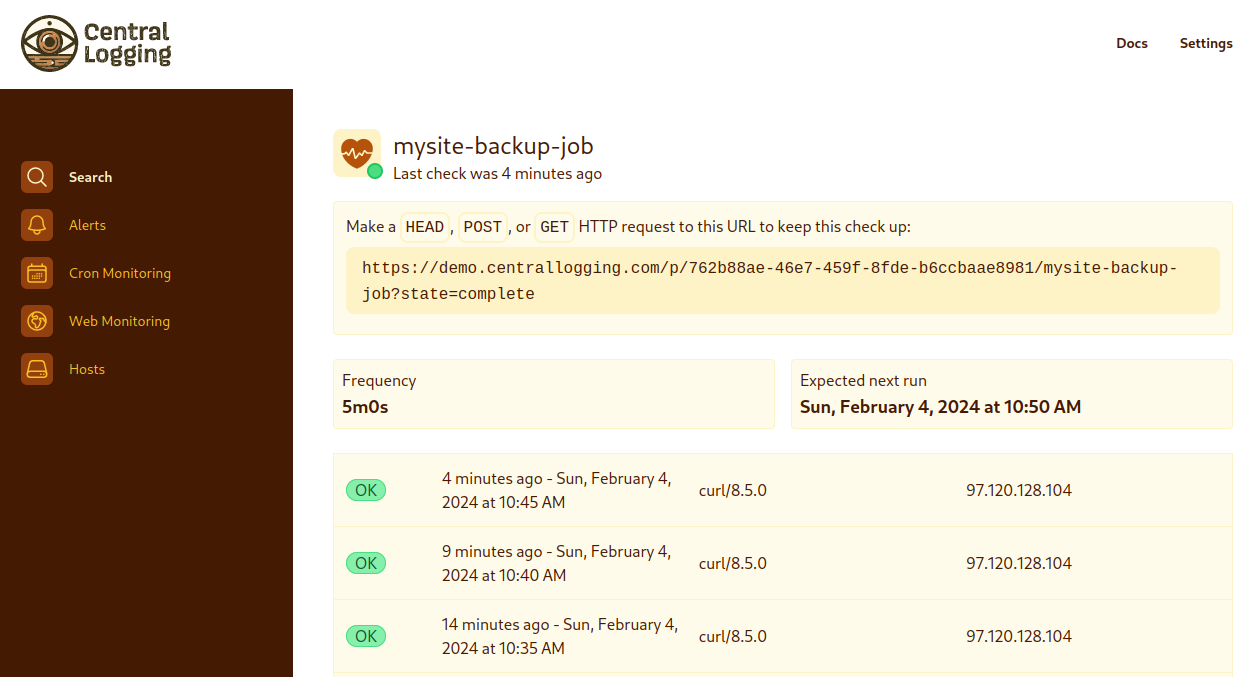
To monitor any job send an HTTP request with API key and job name. Ex:
curl http://localhost:8080/p/your-uuid-apikey/name-of-your-job?state=complete
The API key needs to be created one-time in Central Logging before hand but the job name can be created on the fly. Once you create your API key you can sprinkle these at the end of all your cron jobs and just change the job name to describe the cron.
If you know your job failed, say so:
curl http://localhost:8080/p/your-uuid-apikey/name-of-your-job?state=fail
That notifies you within a minute. You do not wait out the check-in the job was never going to send.
A job that fails every run does not message you every run. The first failure notifies. The next one stays quiet until the job completes successfully, or until a day has passed. Send status_code and message with the ping and both appear in the notification, so the alert says what broke.
You also get one message per broken job, not two. Central Logging works out a job’s schedule from its successful runs, so a job reporting nothing but failures also looks like a job that stopped reporting. It has not stopped. While a failure is outstanding, the “no longer checking in” alert stays quiet. It comes back the moment the job succeeds and then goes missing for real.
If you want to measure how long your job takes or detect when it never completes send a run state before you start your job and a complete when it completes.
States:
startcompletefail
Simple Cron monitor example:
* 0 * * * /important-job.py && curl https://your-central-logging-instance.com/p/<API-KEY>/test-job?state=complete
Recording details with a run
A ping can carry more than a state. Add any of these and Central Logging stores them with that run:
status_code— the exit status the job reported.0means success.message— a short note. Anything past 500 characters is trimmed.metric— aname:valuepair. Repeat it for as many numbers as you want, up to 20 per ping.
Quote the URL so your shell does not read & as “run this in the background”:
curl "https://your-central-logging-instance.com/p/<API-KEY>/test-job?state=complete&status_code=0&message=Backup+Complete&metric=duration:418.44&metric=count:3319"
The job page shows the message and the exit status beside each run. Numeric metrics are charted across the last 100 runs, one chart per metric name. That is how you notice a backup getting slower months before it starts timing out.
Metric values must be numbers. A metric that will not parse is dropped and the rest of the ping is still recorded, so a typo in one metric never costs you the run.
Here is a script that reports its own duration and exit status:
#!/bin/sh
start=$(date +%s)
/important-job.py
code=$?
duration=$(( $(date +%s) - start ))

state=complete
[ "$code" -eq 0 ] || state=fail

curl -s "https://your-central-logging-instance.com/p/<API-KEY>/important-job?state=$state&status_code=$code&metric=duration:$duration"
The ping endpoint accepts GET, POST and HEAD. Use POST with a form body when a message is long enough to be awkward in a URL:
curl -s -X POST https://your-central-logging-instance.com/p/<API-KEY>/important-job -d "state=complete&status_code=0&message=Backed up 412 tables"
💌 Get notified on new features and updates